Perspective Attained - or - How My 64% Can Turn Into A 53%.
Our analysis of the comparison between X-Club results for the 18 clubs that took part in the 2013 NZ-Wide Pairs and the final results for the full field has generated a new perspective on the meaningfulness of cross-scored results.
 Hyperbole
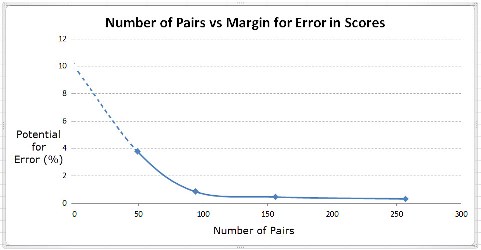
For full details see the following article but for now a picture is worth a thousand words.
Further explanation: the figures along the bottom line represent the numbers of Pairs taking part in any competition. The height of the curve above those numbers is a measure of the expected error for the middle two thirds of the field when the results are compared with those of a very large number of pairs playing the same deals.
An example of the way this graph should be interpreted: the mark on the curve slightly to the left above the 100 is the plot of the data for 94 pairs. Its height above the bottom line happens to be exactly 0.86 which translates to: the scores given for 68% (64 pairs) of a field of 94 can expect to lie between 0.86% more or 0.86% less than their "true" score (that is - the score they would be getting if a very large number of people had played these boards).
Some observations:
- One hundred pairs would be fifty tables - a large tournament indeed. The final scores of two thirds of the players in such a tournament could be +/-0.8% away from their "true" scores.
- Reading further along the line to the next dot at(156,0.47):the scores given for 68% (106 pairs) of a field of 156 can expect to lie between +/-0.47% of their "true" score
- The NZ Pairs at Congress attracted just over 180 pairs. The scores given to two thirds of them would have been within half a percent of their "true" scores. The other one third of scores would have been outside these limits
- Reading back to (49,3.8) :the scores given for 68% (33 pairs) of a field of 49 can expect to lie between +/-3.8% of their "true" score
- The Te Awamutu Xmas Party attracted 20 tables: the final scores for two thirds of the field could have been +/- 4% of their "true" scores. The other third out by even more
- We've probably all noted at times, our scores moving up or down by 4-5% in a two-section tournament
- Reading even further back to below the dotted line kind of gives you an idea of how statistically relevant the scores on a club night of, say, eight tables would be?
We often hear wails of disbelief - "How can my 64% on a club night turn into 53% on X-Clubs??" Now that we have this valuable perspective, we think it certainly explains why. It's a bit shocking to discover what a blunt instrument club scoring actually is.
